












PV-10 is a simplified discounted cash flow (DCF) which uses a 10% discount rate to present value the forecasted reserve report cash flows. The reserve report is specific to a particular set of oil and gas assets prepared by petroleum engineers and includes the forecasted production, prices, revenues, and expenses.
Publicly traded U.S. companies, subject to Securities and Exchange Commission (SEC) reporting requirements, commonly disclose PV-10 figures for oil and gas reserves in their Form 10-K filings. PV-10 is often mistakenly understood to be a proxy for fair value or fair market value in upstream oil and gas valuation. PV-10 is a standardized measure meant to facilitate the comparison of upstream reserves, but the PV-10 framework oversimplifies many key valuation assumptions which can cause significant differences to fair value1 (FV) and fair market value2 (FMV). For simplicity I will use fair value, but the discussion applies to both fair value and fair market value.
Oversimplification of Reserve Categories
Under the simplified PV-10 framework the upstream reserve volumes are treated the same, which ignores the relative risk of reserve categories. From least to greatest risk and current to future wells, reserve categories include proved developed producing reserves, proved developed non-producing reserves, proved undeveloped reserves, probable reserves, and possible reserves.
Fair value considers that all volumes are not of equal risk by applying reserve adjustment factors (RAFs) or risk-adjusted discount rates (RADRs) to each reserve category. These are discrete adjustments to volumes or discount rates to reflect the incremental risk of reserve categories such as current vs. future wells or proved vs. possible volumes. RAFs can vary from 100% to 0% depending on the reserve category, reflecting full to zero risk-adjusted volumes and RADRs can vary significantly above PV-10’s 10% discount rate. While the risk profile varies depending on the unique composition of the reserves, PV-10 figures use no RAF and a 10% discount rate on all volumes, which can lead to large differences compared to fair value.
Backward Looking Commodity Prices
Another simplification embedded into PV-10 figures is the use of backward-looking commodity prices as opposed to forward-looking commodity prices. Pricing in the oil and gas markets is primarily driven by supply, demand, geopolitics, and technology. Under PV-10, the SEC requires the use of the average historical first-day-of-the-month price for the 12 months leading up to the balance sheet date. Whereas under fair value forward-looking pricing is used, adjusted for differentials on the futures contracts, which incorporates the actual outlook as of the valuation date. The charts below show oil and gas pricing during COVID and the Russia-Ukraine war which are recent examples where backward-looking and forward-looking pricing diverged substantially.
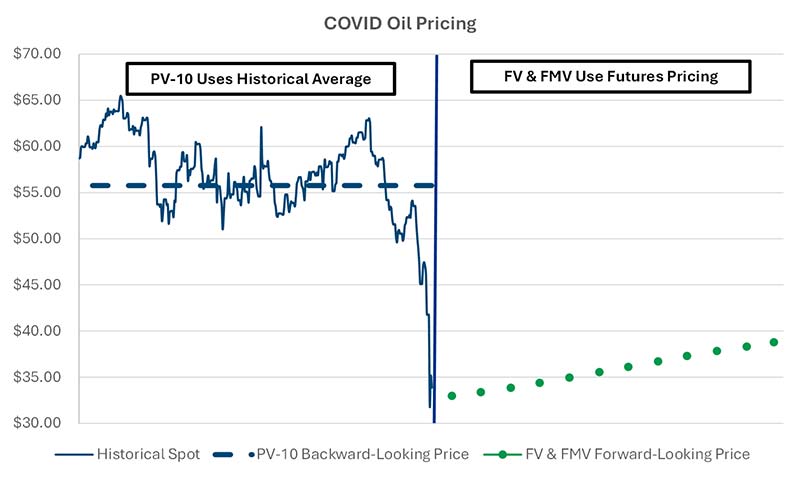
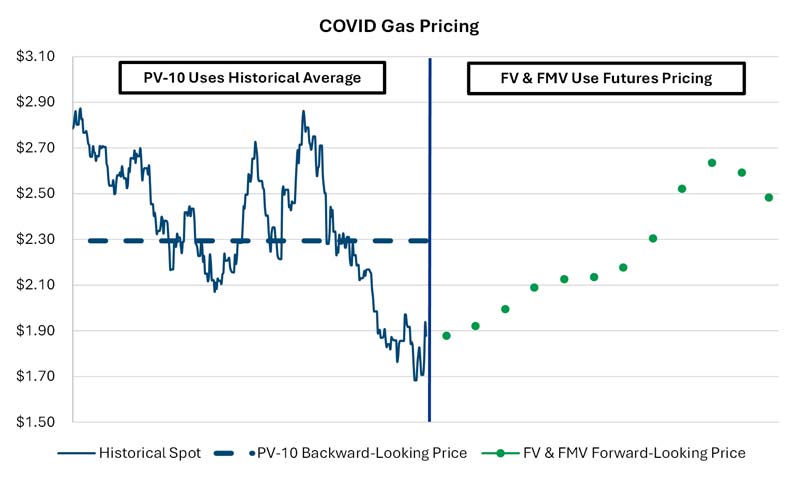
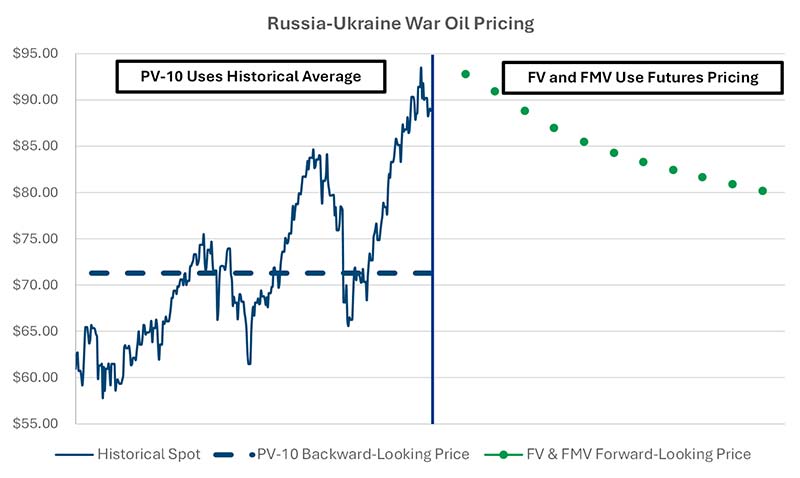
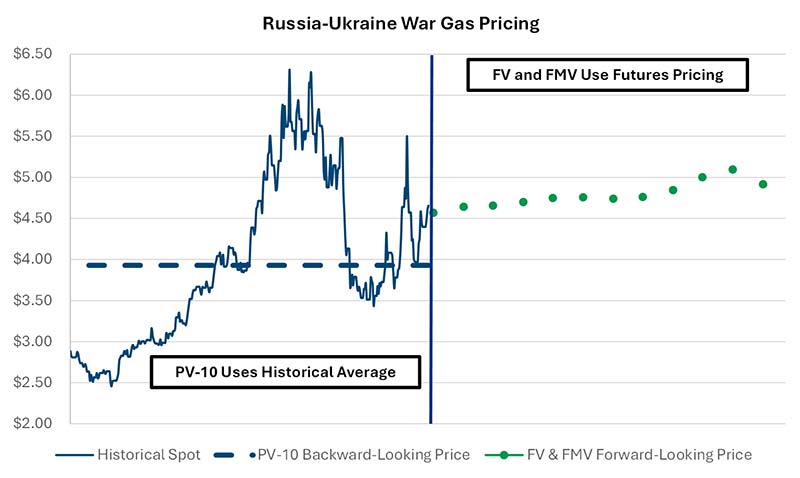
While the above situations are on the extreme end of diverging backward-looking and forward-looking pricing, this illustrates another limitation of PV-10 figures that can lead to substantial differences compared to fair value.
Oversimplification of the Interest Rate Environment
In addition to the limitation of the discount rate related to the risk of the reserves discussed above, PV-10 figures also ignore the actual interest rate environment by using a static 10% discount rate across time. The interest rate environment fluctuates as both the risk-free rates and spreads above the risk-free rate change across time. For perspective, on the short end of the yield curve, the Federal Funds Effective Rate has been as high as 22.36% in the 1980s during record inflation and as low as 0.04% following the Great Recession with recent readings at approximately 3.6% as shown in the chart below.
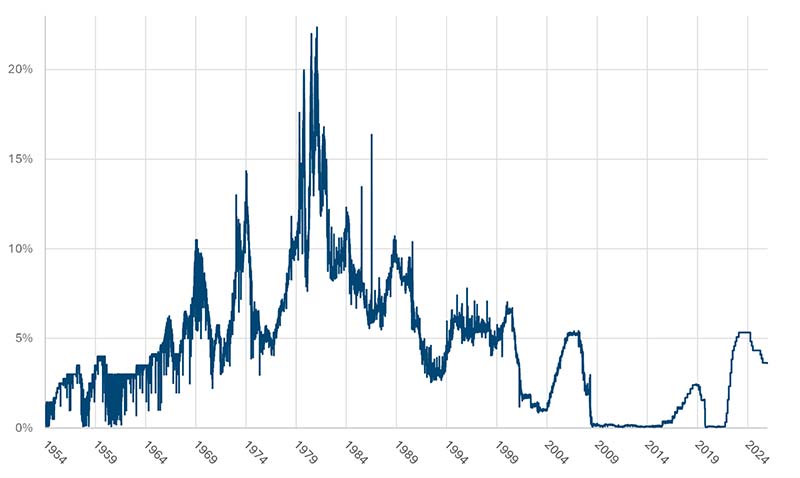
The risk-free interest rate is the starting point for all other interest rates, including the cost of equity and cost of debt in the WACC, which layer on one or more risk premiums for various risk attributes for the specific interest rate (i.e. the S&P Global 10Y AAA energy cost of debt was 5.08% vs. 4.56% for the 10Y U.S. Treasury bond on July 10, 2026). The risk-free interest rate using the 20Y U.S. Treasury has been as high as 15.78% in the 1980s during record inflation and as low as 0.87% during COVID with recent readings at approximately 5.1% as shown in the chart below.
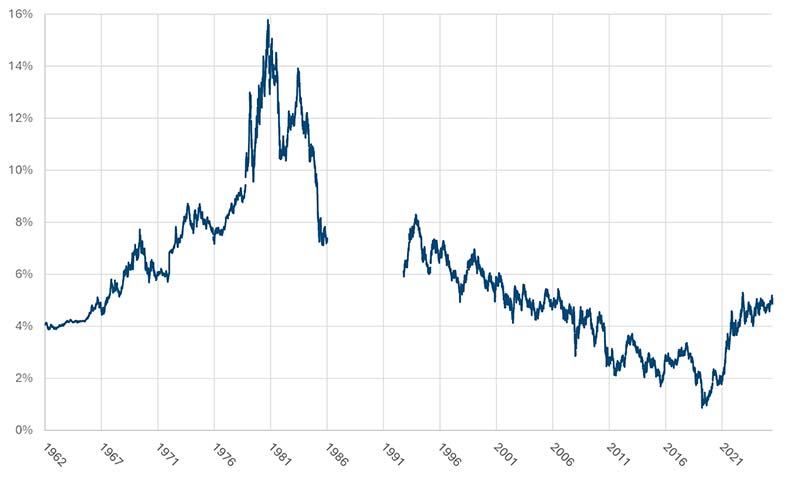
Unlike PV-10’s static 10% discount rate across time, the actual interest rate environment and the risk profile of the specific reserves being valued are taken into account in the WACC developed under fair value which can contribute to meaningfully different reserve values.
Zero Tax Assumption and Mismatched Discount Rate
Further, PV-10 figures assume zero income taxes, which mismatches pre-tax cash flows with the post-tax discount rate. Regardless of the legal entity and tax election for any given reserve assets, income taxes are a reality for a profitable upstream operation. Future cash flows should be present valued using a discount rate that is consistent with the cash flows (i.e., pre-tax cash flows with a pre-tax discount rate or post-tax cash flows with a post-tax discount rate). Income tax rates vary widely by country and state/province. Both limitations under the PV-10 framework can contribute to substantial differences compared to the fair value.
Lack of Market Approach Corroboration
Additionally, PV-10 figures are a single estimate based on simplified assumptions and do not include any corroborative analyses. Under fair value, the guideline public company method (GPC Method) and the guideline transaction method (GT Method) look at the prices and multiples paid for similar companies that trade in the public stock market and the mergers and acquisitions market, respectively, in order to arrive at a concluded value. The GPC Method and GT Method are corroborative analyses used in fair value to support the DCF conclusion.
Additional Upstream Reserve Considerations
Several additional factors can also cause differences between PV-10 figures and fair value. These include the treatment of asset retirement obligations, inflation assumptions on both pricing and expenses, corporate overhead, and whether the working interest being valued is operating or non-operating.
For operators, investors, and advisors working through oil and gas reserve valuation questions, understanding these differences is essential. While PV-10 is simple and readily available, fair value and fair market value analyses incorporate the specific facts and circumstances that PV-10 glosses over, resulting in a more realistic and defensible concluded value.
Our team would love the opportunity to help with your specific situation whether it’s an upstream, midstream, or downstream valuation contact our CBIZ valuation team.
1ASC 820 defines fair value as “The price that would be received to sell an asset or paid to transfer a liability in an orderly transaction between market participants at the measurement date.”
2U.S. Treasury Regulation §25.2512-1 defines fair market value as “…the price at which such property would change hands between a willing buyer and a willing seller, neither being under any compulsion to buy or to sell, and both having reasonable knowledge of relevant facts.”
© Copyright CBIZ, Inc. All rights reserved. Use of the material contained herein without the express written consent of the firms is prohibited by law. This publication is distributed with the understanding that CBIZ is not rendering legal, accounting or other professional advice. The reader is advised to contact a tax professional prior to taking any action based upon this information. CBIZ assumes no liability whatsoever in connection with the use of this information and assumes no obligation to inform the reader of any changes in tax laws or other factors that could affect the information contained herein. Material contained in this publication is informational and promotional in nature and not intended to be specific financial, tax or consulting advice. Readers are advised to seek professional consultation regarding circumstances affecting their organization.
“CBIZ” is the brand name under which CBIZ CPAs P.C. and CBIZ, Inc. and its subsidiaries, including CBIZ Advisors, LLC, provide professional services. CBIZ CPAs P.C. and CBIZ, Inc. (and its subsidiaries) practice as an alternative practice structure in accordance with the AICPA Code of Professional Conduct and applicable law, regulations, and professional standards. CBIZ CPAs P.C. is a licensed independent CPA firm that provides attest services to its clients. CBIZ, Inc. and its subsidiary entities provide tax, advisory, and consulting services to their clients. CBIZ, Inc. and its subsidiary entities are not licensed CPA firms and, therefore, cannot provide attest services.