
Throughout the past year, we have published several articles discussing significant challenges in the area of physician compensation – primarily driven by the COVID-19 pandemic and changes to the Medicare Physician Fee Schedule (MPFS).
Since our most recent article, we have been able to validate further the effect of these changes on published market data sources. While none of us have a crystal ball, we used historical data along with our professional experience to predict where the market data may go in the future. We selected three data points to analyze: Total Compensation, wRVU Productivity, and Compensation per wRVU. Each of these data points is integral to supporting productivity-based compensation plans, with work Relative Value Units (wRVUs) being the most popular productivity measure used in productivity-based compensation plans, and Compensation per wRVU as a best practice for defending Fair Market Value (FMV) compensation for highly compensated physicians. For each of the metrics, we will discuss the past, present, and future.
Total Compensation
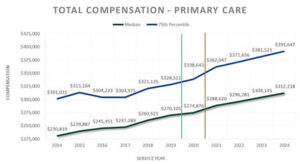
Table 1: Total Compensation – Primary Care
Past
As you can see in the table above, from 2014 through 2019, primary care compensation grew fairly consistently and predictably, increasing at the median between 0.7% and 5.4% per year, with a compound annual growth rate (CAGR) of 2.7%.
Present
As shown in Table 1, 2020 compensation stayed relatively flat with an increase of only about 1.8%, slightly less than the CAGR. This is likely driven by hospitals keeping physicians whole and private practices receiving subsidization through programs such as the CARES Act Provider Relief Fund and the Paycheck Protection Program.
Future
As discussed in The Road to Tomorrow, changes to the 2021 MPFS included increases in wRVU weights for Evaluation and Management (E&M) codes. Many hospitals are choosing to move to the new MPFS weights. If these hospital employers do not make any adjustments to their productivity-based compensation plans, we expect to see an increase in Total Compensation as high as 20% due to these higher E&M code weightings. Other hospitals are moving to the new MPFS weights but decreasing their conversion factors. Still others have implemented a compensation moratorium and are delaying adjustments until they see another year of market data. For purposes of the analysis presented in Table 1, we conservatively assumed a 5% increase from the actual 2020 compensation data to the 2021 projected data. We then assumed a 2.7% increase in subsequent years, equal to the historical CAGR.
wRVU Productivity
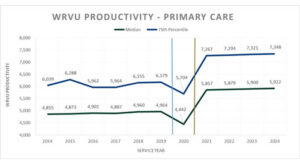
Table 2: wRVU Productivity – Primary Care
Past
Similar to Total Compensation, wRVU Productivity stayed fairly consistent and predictable between 2014 and 2019, at both the median and 75th percentile. Median wRVUs grew between zero and 1% annually during this historical period.
Present
As we anticipated, the events of 2020 resulted in a loss of predictability in many market data metrics. wRVU Productivity fell nearly 11% from 2019 to 2020, underscoring the significant toll that the COVID-19 pandemic had on the healthcare system.
Future
We predict that wRVU Productivity will rebound from the 2020 dip caused by COVID-19. Patients will continue to have care needs, and providers have adapted to working in the new normal. Additionally, future wRVU Productivity will reflect the new E&M weights from the 2021 MPFS. As a result, we assumed that at the median, wRVU Productivity would increase nearly 32% from 2020, or an 18% increase from 2019, with a similar increase at the 75th percentile.
Compensation per wRVU
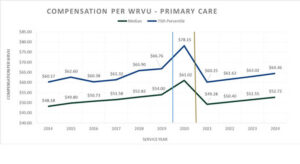
Table 3: Compensation per wRVU – Primary Care
Past
As a result of consistent compensation and wRVU productivity, Compensation per wRVU has historically been relatively stable and predictable, increasing at the median between 1.9% and 3.4% from 2014 to 2019.
Present
Stable Total Compensation combined with falling wRVU Production resulted in a significant spike in Compensation per wRVU in 2020. At the median, we saw Compensation per wRVU increase by 13% from 2019 to 2020. This considerable increase in Compensation per wRVU represents the biggest challenge facing wRVU productivity-based physician compensation plans moving forward.
Future
We predict that 2020 Compensation per wRVU levels reflected in the market data will not hold. As illustrated in Table 3 above, estimated Total Compensation growth, combined with significant wRVU Productivity increases in 2021, is likely to result in reported Compensation per wRVU plummeting to levels below 2019. Employers who have traditionally targeted median Compensation per wRVU and continue that practice into 2022 and beyond could find themselves in a dilemma. This situation may force them to either decrease Compensation per wRVU (never an easy task) or find themselves paying Compensation per wRVU at or above the 75th percentile, potentially creating exposure to FMV and commercial reasonableness compliance risks.
Alternate Compensation Scenario
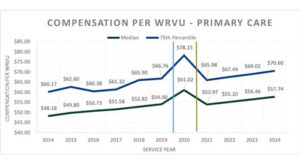
Through changes to the 2021 MPFS, CMS intended to increase the reimbursement and value of physicians who primarily generate wRVUs from E&M services. If CMS had not simultaneously decreased the Medicare conversion factor, they might have done so. However, even absent that funding, it is possible that hospitals may either base their productivity-based plans on the 2021 wRVU weights or follow the 2020 market data spike and increase Compensation per wRVU. Some could do both. These factors could result in a much more significant increase in Total Compensation than that modeled above. As such, we considered the impact of a 15% increase in compensation. Assuming the same recovery and growth in wRVUs discussed above, we expect to see a notable decline in Compensation per wRVU from 2020, as illustrated in Table 3A below.
Table 3A: Alternate Scenario – Compensation per wRVU – Primary Care
Under this scenario, hospitals may face the following concerns:
- $50,000+ compensation increases with little to no increase in professional fee reimbursement, resulting in increased levels of support per FTE physician;
- Precedent-setting compensation levels may cause hospitals that have traditionally paid around median comp per WRVU to be paying closer to 75th percentile; and
- FMV and commercial reasonableness compliance concerns.
Medical Specialties and Surgical Specialties
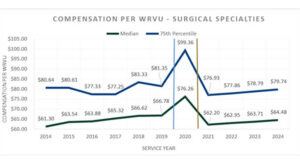
The trends for Medical Specialties and Surgical Specialties through 2020 are very similar to Primary Care, with 2020 showing fairly stable compensation partnered with significant decreases in wRVU Productivity, resulting in material spikes in Compensation per wRVU. We anticipate that future increases in wRVUs for medical specialties will be less significant than primary care, but still recovery from COVID-19 and a 6-8% bump related to the 2021 MPFS E&M weight increases. Surgical specialties will be less impacted by 2021 MPFS E&M weight increases but will likely show greater recovery from their COVID-19 related declines. For both groups, we predict significant declines in Compensation per wRVU, as illustrated in Tables 4 and 5 below.
Table 4: Compensation per wRVU – Medical Specialties
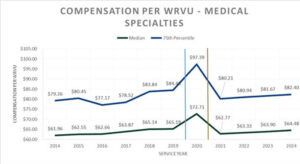
Table 5: Compensation per wRVU – Surgical Specialties
Solutions
From our perspective, there are many options hospitals and health systems can use to avoid these issues. First, organizations can choose to largely ignore the 2020 market data to avoid anomalies caused by COVID-19. Next, instead of relying on any one year’s market data points, reliance could instead be placed on a multiple-year trailing average. The best compensation plans are supportable not only based on current year data, but continue to be supportable through market fluctuations. The safest way to ensure ongoing FMV compliance is to obtain an opinion from an experienced, independent, third-party valuation company, such as CBIZ.
For assistance as you navigate these changes and to ensure you are setting up your organization for success, contact the CBIZ Healthcare Consulting Team:
[1] Medical Group Management Association (MGMA) – Compensation and Production Survey 2015 Report based on 2014 data through the 2021 Report based on 2020 data; American Medical Group Association (AMGA) – Medical Group Compensation and Productivity Survey, 2015 Report based on 2014 data through the 2021 Report based on 2020 data and; Sullivan Cotter and Associates (SCA) – Physician Compensation and Productivity Survey, 2015 Report Based on 2014 data through the 2021 Report based on 2020 data.
[2] Historical data points are based on appraiser judgment and consider reported data from multiple surveys.
[3] WRVU increase estimated based on client experience and industry knowledge.
© Copyright CBIZ, Inc. All rights reserved. Use of the material contained herein without the express written consent of the firms is prohibited by law. This publication is distributed with the understanding that CBIZ is not rendering legal, accounting or other professional advice. The reader is advised to contact a tax professional prior to taking any action based upon this information. CBIZ assumes no liability whatsoever in connection with the use of this information and assumes no obligation to inform the reader of any changes in tax laws or other factors that could affect the information contained herein. Material contained in this publication is informational and promotional in nature and not intended to be specific financial, tax or consulting advice. Readers are advised to seek professional consultation regarding circumstances affecting their organization.
“CBIZ” is the brand name under which CBIZ CPAs P.C. and CBIZ, Inc. and its subsidiaries, including CBIZ Advisors, LLC, provide professional services. CBIZ CPAs P.C. and CBIZ, Inc. (and its subsidiaries) practice as an alternative practice structure in accordance with the AICPA Code of Professional Conduct and applicable law, regulations, and professional standards. CBIZ CPAs P.C. is a licensed independent CPA firm that provides attest services to its clients. CBIZ, Inc. and its subsidiary entities provide tax, advisory, and consulting services to their clients. CBIZ, Inc. and its subsidiary entities are not licensed CPA firms and, therefore, cannot provide attest services.